![]() A few months ago, in July, I published an article in HPCwire and here on LinkedIn describing why I thought that this year, 2016, would be one of the most important in two decades for the HPC industry. This is the year that Intel introduced the latest Phi generation and NVIDIA deploys the Pascal P100. We here at SRT have been waiting patiently since then for the release of P100 and recently obtained access through colleagues at IBM. This blog post presents the first exciting P100 results running ECHELON, our high-performance GPU-based reservoir simulator. ECHELON is an excellent application to benchmark on new GPU architectures because it’s one of the few number-crunching technical codes that runs entirely on GPU. The results are good…very good in fact and I’m eager to present them not only because they will be an encouragement to those invested in GPU computing efforts, but also because they validate an assertion that I’ve been promoting in my public talks for many years. Without further delay, the results:
A few months ago, in July, I published an article in HPCwire and here on LinkedIn describing why I thought that this year, 2016, would be one of the most important in two decades for the HPC industry. This is the year that Intel introduced the latest Phi generation and NVIDIA deploys the Pascal P100. We here at SRT have been waiting patiently since then for the release of P100 and recently obtained access through colleagues at IBM. This blog post presents the first exciting P100 results running ECHELON, our high-performance GPU-based reservoir simulator. ECHELON is an excellent application to benchmark on new GPU architectures because it’s one of the few number-crunching technical codes that runs entirely on GPU. The results are good…very good in fact and I’m eager to present them not only because they will be an encouragement to those invested in GPU computing efforts, but also because they validate an assertion that I’ve been promoting in my public talks for many years. Without further delay, the results:
P100 benchmarking results
Three different reservoir models were used for this study, Model A (4.4M cells), Model B (9M cells) and Model C (2M cells). These models were run by ECHELON on three different NVIDIA GPU platforms, the K40, the Pascal Titan X and the Pascal P100. Table 1, below, lists these chips along with their corresponding specifications for memory bandwidth and single/double precision FLOPS. The K40 and Titan X numbers were collected using internal SRT workstations, standard Intel Xeon based machines with the GPU boards installed via PCIe. The P100 results were collected using a cluster of IBM OpenPower nodes each with two Power8 processors (10 cores each) and 4 NVIDIA P100 boards. As noted in the table, each P100 delivers 732GB/s of main memory bandwidth and 10.6 TeraFLOPs (single precision). The GPUs are interconnected with each other and with the Power8 processor via NVIDIA’s NVLINK technology which delivers 5x the message passing bandwidth of PCIe.
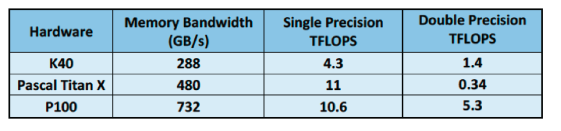
Table 1 NVIDIA hardware used in this benchmarking study. Comparing memory bandwidth and FLOPS
Figure 1, below, shows the results of running each of the three models on the three different hardware platforms. The performance results are normalized to the K40 to make it easier to compare between models, so K40 performance is 1.0 by definition. I note here that the K40 results were already many times faster than the most commonly used legacy simulator. One can read off the charts that for Model A the P100 was 2.56x faster than the K40. For Model B it was 2.3x faster and for Model C, 2.76x faster. On average the P100 was 2.54x faster than the K40. The results are impressive and exciting, but if we dig a little deeper I find evidence for an interesting assertion I’ve been making for some time.

Figure 1 ECHELON performance for three different models on NVIDIA K40, Titan X and P100 platforms, normalized to K40.
The return of Moore’s law performance scaling
There are two hardware specifications that interest HPC practitioners. The first measures how fast a particular processor can do calculations (FLOPs) and the second measures how fast data can be moved into the processor (memory bandwidth). Before about 2004, the performance of most technical codes was constrained by FLOP capability. Since FLOPs are directly related to processor clock speed there was a long period of time when application performance improved with each generation of faster CPU. Performance came for free with little or no changes to code. These were wonderful times! As multi-core chips and vectorized registers arrived in the 2000’s FLOP capacity increased rapidly and outpaced bandwidth. In fact over the last 20 years the ratio of bandwidth to FLOPS (sometimes referred to as computational intensity) has decreased by a factor of 50 for CPUs! Performance gains no longer came for free with each new chip generation. Significant and skilled work was required to parallelize codes through message passing (between nodes), threading (on the node) and vectorizing (in the processor) to realize more speed. As a result, many codes went through a “performance pause”, and still reside there, reaping very little gain from new generations of CPU processors.
For the past several years, in both public and private presentations I’ve made a statement that has been part tech prediction and part finger-crossing hope. It’s gratifying to see it validated by the data I will present below. Simply put, I stated that the performance of applications developed for GPUs will scale with generational hardware improvements and require minimal changes to code just like those halcyon days of clock scaling pre-2004. Figure 2, below, is a different presentation of the same data which highlights performance gains vs memory bandwidth. It plots ECHELON’s speed vs memory bandwidth where ECHELON’s speed is normalized to the K40 i.e. the speed on the K40 is defined as 1.0. The fascinating and exciting conclusion that we draw is that performance gains are almost directly proportional to the memory bandwidth provided. Projecting ahead to NVIDIA Volta and beyond we can look forward to systematic leaps in code performance with each new generation of hardware. Moore’s law performance scaling is back!

Figure 2 ECHELON speed vs hardware memory bandwidth for three different models
I would like to express sincere thanks to IBM for providing access to the Power8/P100 cluster used in this benchmarking effort. I would also like to thank Dr. Ken Esler(SRT) for running the models. For more information on the IBM NVLINK cluster please see this article by Sumit Gupta https://www.ibm.com/blogs/systems/ibm-nvidia-present-nvlink-server-youve-waiting.

Discussion
No comments yet.